Property Selection
Navigate the application
Upon launching the application, the “Property Selection” tab is displayed, as shown in Figure 5. This tab serves as the starting point for the property selection process. Users can navigate between different tabs by clicking on the corresponding tab names. The tabs are as follows:
Property Selection: Select the data to use in the predictive models.
Train Test Split: Split the data into training and testing datasets.
Property EDA: Visualize the distribution of each property.
Model Selection: Select, run, and inspect the outputs of the model to be used for the prediction.
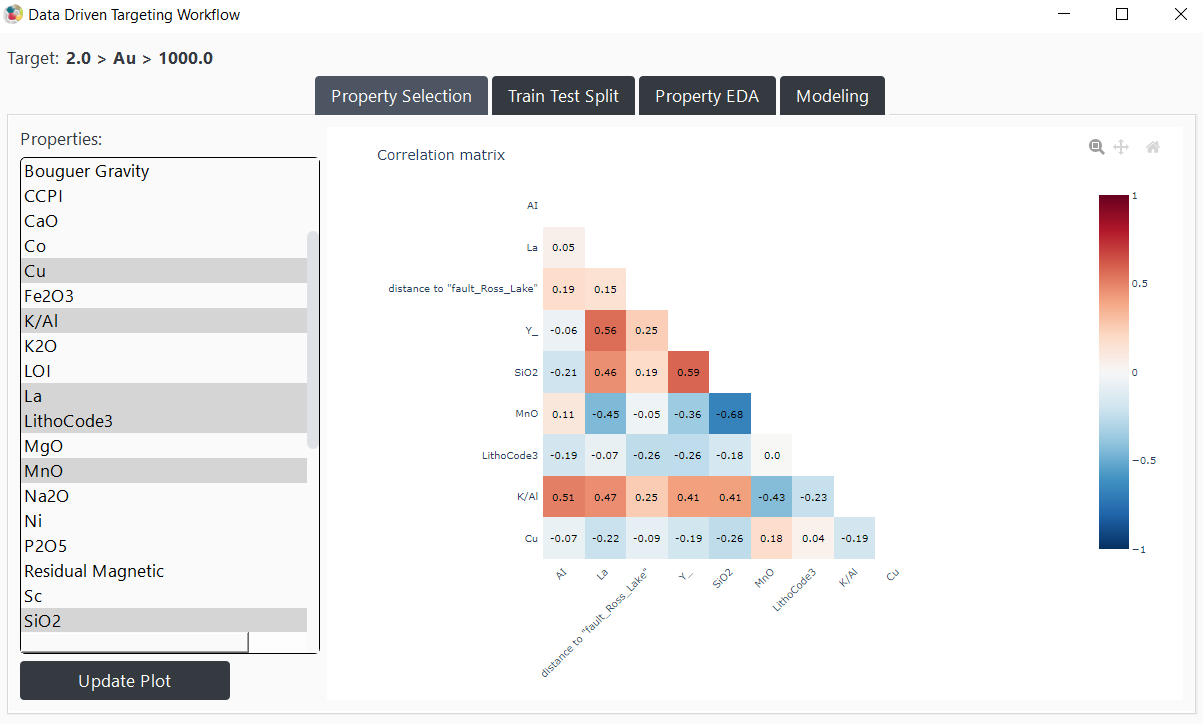
Figure 5 The application opens on the “Property Selection” tab; then, users can navigate back and forth between the different tabs.
Note that all images can be saved as PNG by clicking the camera icon in the top right corner of each figure. A dialog will appear, allowing you to choose a location to save the image. The images will be saved at the same resolution as displayed in the application.
Select the properties
The “Property Selection” tab is divided into two sections: the left side for selecting properties, and the right side for displaying the correlation matrix between the properties. The left section allows users to select or deselect various properties for use in modeling. To modify your selections, simply click on the desired properties and press update.
By default, the properties are preselected to exclude those with too many no-data values. However, the intersection of selected properties can still lead to an empty dataset. In such cases, an error will be raised. Simply deselect the properties causing the issue and press Update again.
As users select properties, the application will display a message in the console indicating the number of available points for the selected properties. This information helps users understand how many data points will be used in the predictive models. If there are too few positive or negative training points, users should be aware that the model might overfit. Additionally, if no points are available, an error will be raised. Users should then adjust their selection to ensure a sufficient number of data points for training.
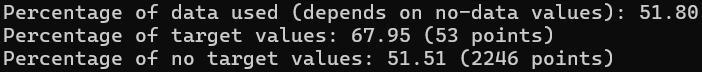
Figure 6 When properties are selected, a message showing the number of available points is printed.
Correlation Matrices
Three matrices can be visualized in the “Property Selection” tab. Users can navigate between these matrices using the buttons at the top right of the images. The available matrices are:
1. Pearson Correlation Matrix
The Pearson correlation matrix shows the linear relationships between properties across the entire dataset. For any two properties, the correlation is calculated using all common data points, excluding any with missing values. A high correlation value (close to 1 or -1) indicates that the two properties carry similar information. In such cases, it is recommended to deselect one of them to avoid redundancy.
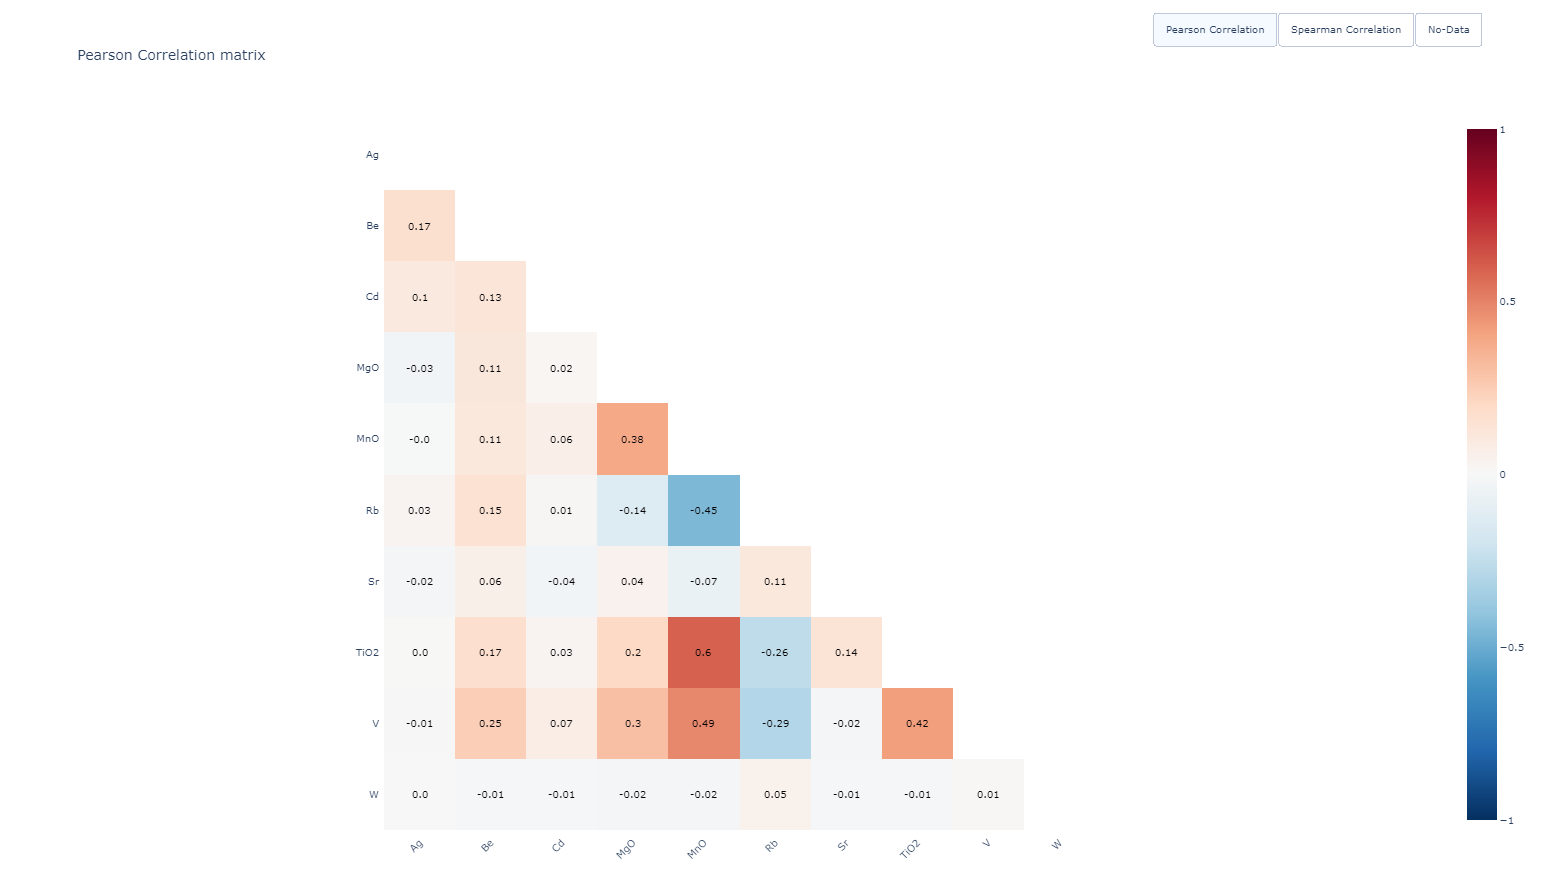
Figure 7 Pearson Correlation Matrix
2. Spearman Correlation Matrix
The Spearman correlation matrix is useful for identifying non-linear relationships. It is computed using the rank of the data points rather than their actual values, making it more robust to outliers and non-linear patterns. This matrix complements the Pearson matrix by revealing additional dependencies between properties.
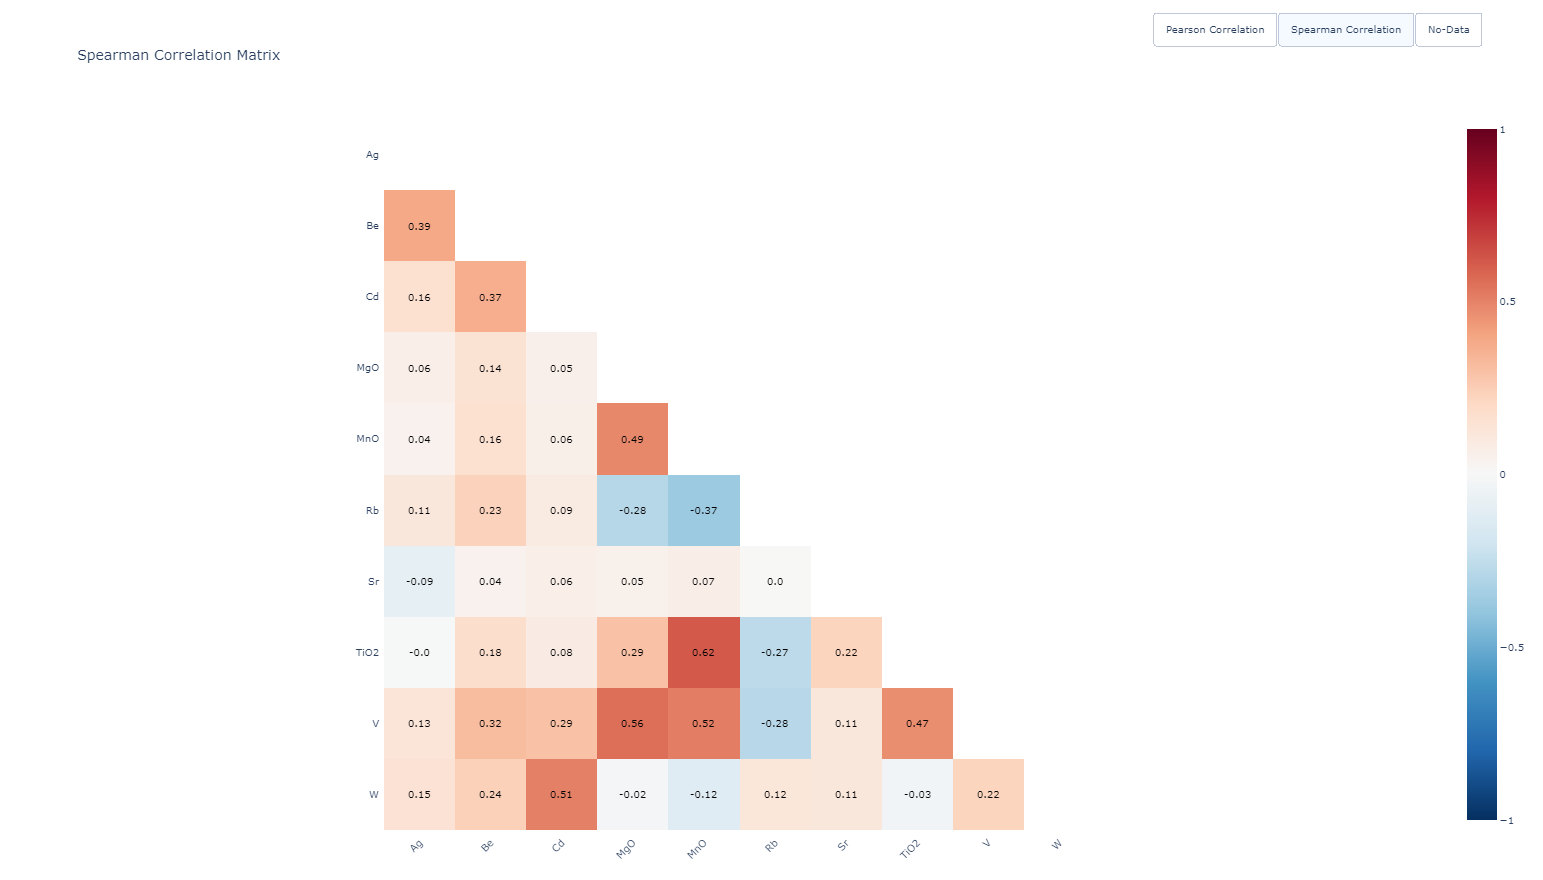
Figure 8 Spearman Correlation Matrix
3. No-Data Matrix
The No-Data matrix displays the percentage of missing values for each property. It allows users to quickly identify properties with high levels of missing data, which may compromise model performance. Properties with a high proportion of no-data values should be deselected to maintain dataset quality. The matrix also includes the target and non-target properties, providing insight into their respective completeness.
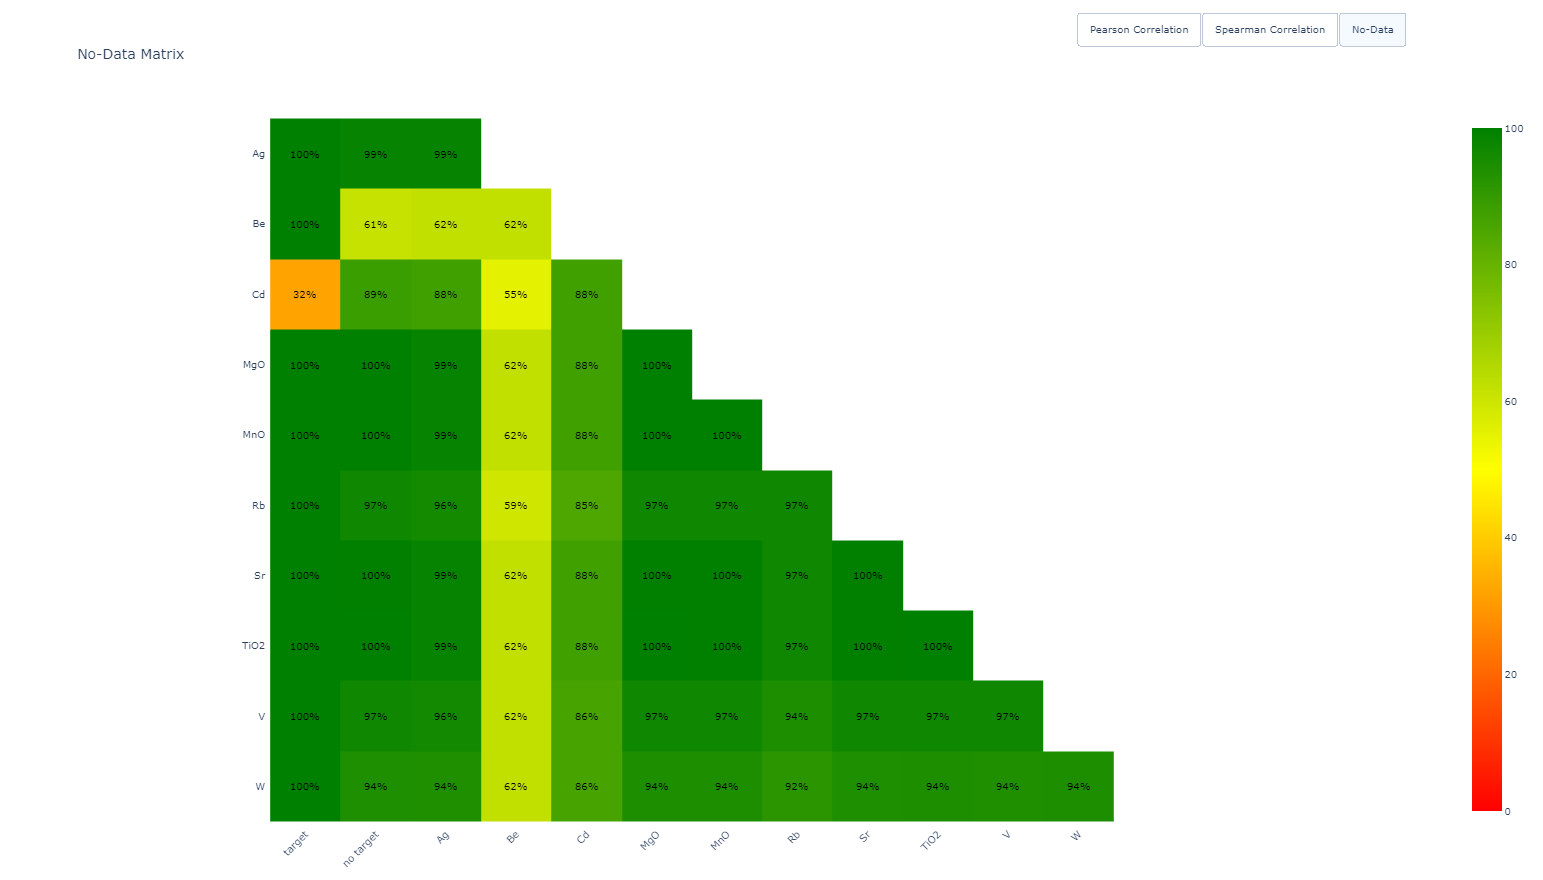
Figure 9 No-data Matrix
Why is property selection important?
Selecting or deselecting data is a critical step in the process, as certain data may be relevant, while others could introduce bias. In general, an expert should select properties that are geologically relevant and avoid those that are not. The best properties might be found through a trial-and-error process until a good balance between validation score and the relevance of selected properties is achieved.
For example, data that replicate the information of the target (e.g., distance to mineralization) should be deselected. Additionally, data that lack geological relevance (e.g., time, distance to drill holes) should also be omitted.
This approach can be applied at different scales. Some properties can be geologically known to be associated with mineralization. Using those properties might yield a better validation score but will miss areas where a potential distal alteration halo is visible. Moreover, different predictions using different properties can yield different results that may be of interest for various exploration strategies.
For example, in the Flin Flon case example, Silver, Copper, Zinc, and Arsenic are not selected as they are known to be associated with the proximal alteration of mineralization. Instead, we are looking for distal alteration to find new targets. But in a different context, these properties could be selected to search for the areas associated with proximal alteration.
Handling Missing Values
It is possible that some of the selected properties may also contain missing values, which can cause issues within the application. Error messages may appear at the start, indicating ‘properties contain no data values’.
To address this, users should deselect properties with a high percentage of missing values. The No-Data Matrix, available in the “Property Selection” tab, helps identify such properties and should be used to guide selection. Additionally, users can monitor the number of valid points remaining after selecting properties, which is displayed in the console.
It is essential to note that the final prediction will not be computed for any point with missing values in one or more of the selected properties. Therefore, handling missing values—by removing affected properties, imputing values, or preprocessing upstream in Geoscience ANALYST, is a critical step in ensuring successful and reliable modeling.