Export Results
Once the data are computed, they can be exported to Geoscience ANALYST by clicking on the “Export to GA” button. The exported data consist of probabilities calculated by the algorithm, as shown in Figure 14 (A). In this figure, only the points with probabilities between 0.5 and 1 are presented. The original targets are presented by hexagons around the points. Probabilities above 0.5 indicate a likelihood of being classified as positive and a probabilities below 0.5 suggest a likelihood of being classified as negative, according to the model’s parameters.
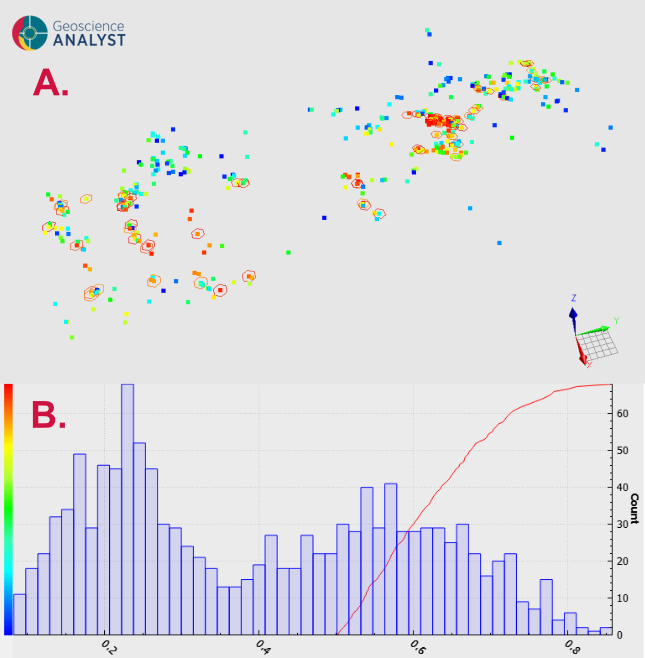
Figure 14 Exported data to Geoscience ANALYST: A. the probabilities computed by the algorithm. B. the histogram of the probabilities.
The distribution of these probabilities, when visualized in a histogram (see Figure 14 .B), can serve as a valuable indicator of the model’s relevance. A skewed distribution of data, where all points are clustered near 1 or 0, may signal overfitting. This occurs when the model is too closely fitted to the training data, potentially compromising its ability to generalize to new, unseen data.
The information about the model parameters and used properties are available in the metadata of the selected object.